2022: Another Space Odyssey
Research: January - May 2022
Tech:
# Python, Java, Processing
# computer vision
# live motion capture
# live video projection
Art and Science:
# math
# Voronoi diagram
# experimental performance art
# interactive media
Performance: May 12th, 13th, and 14th, 2022
At Richard B. Fisher Center for the Performing Arts, Annandale-on-Hudson, NY
Choreographer: Rose Xu (徐子瑜)
Music: Bowsprit – Balmorhea
Visual Designer and Engineer: Rose Xu (徐子瑜)
Performers: Leslie A. Morales, Antonia Salathé, Elsa Wood
Advisor and Concert Coordinator: Prof. Yebel Gallegos
Lighting Designer: Brian Aldous
Costume Designer: Liz Prince
Video Supervisor: Kat Pagsolingan
Stage Manager: Laura Hirschberg
Special thanks to Prof. Keith O’Hara for his generous guidance on the interactive computer programming components of this project.
Many thanks to Prof. Yebel Gallegos for his wise advice during my creative process and his unwavering support as I move through difficult times.
Much appreciation to Olivia Buzzelle, Jacinta Creel, Gaby Sabogal, and Isabella Spagnuolo for their contribution and dedication in the choreography of this piece.
Invited to perform at Gibney Dance Company, New York City, May 2023.
︎︎︎ Suggest viewing this page on desktop/laptop in fullscreen :)

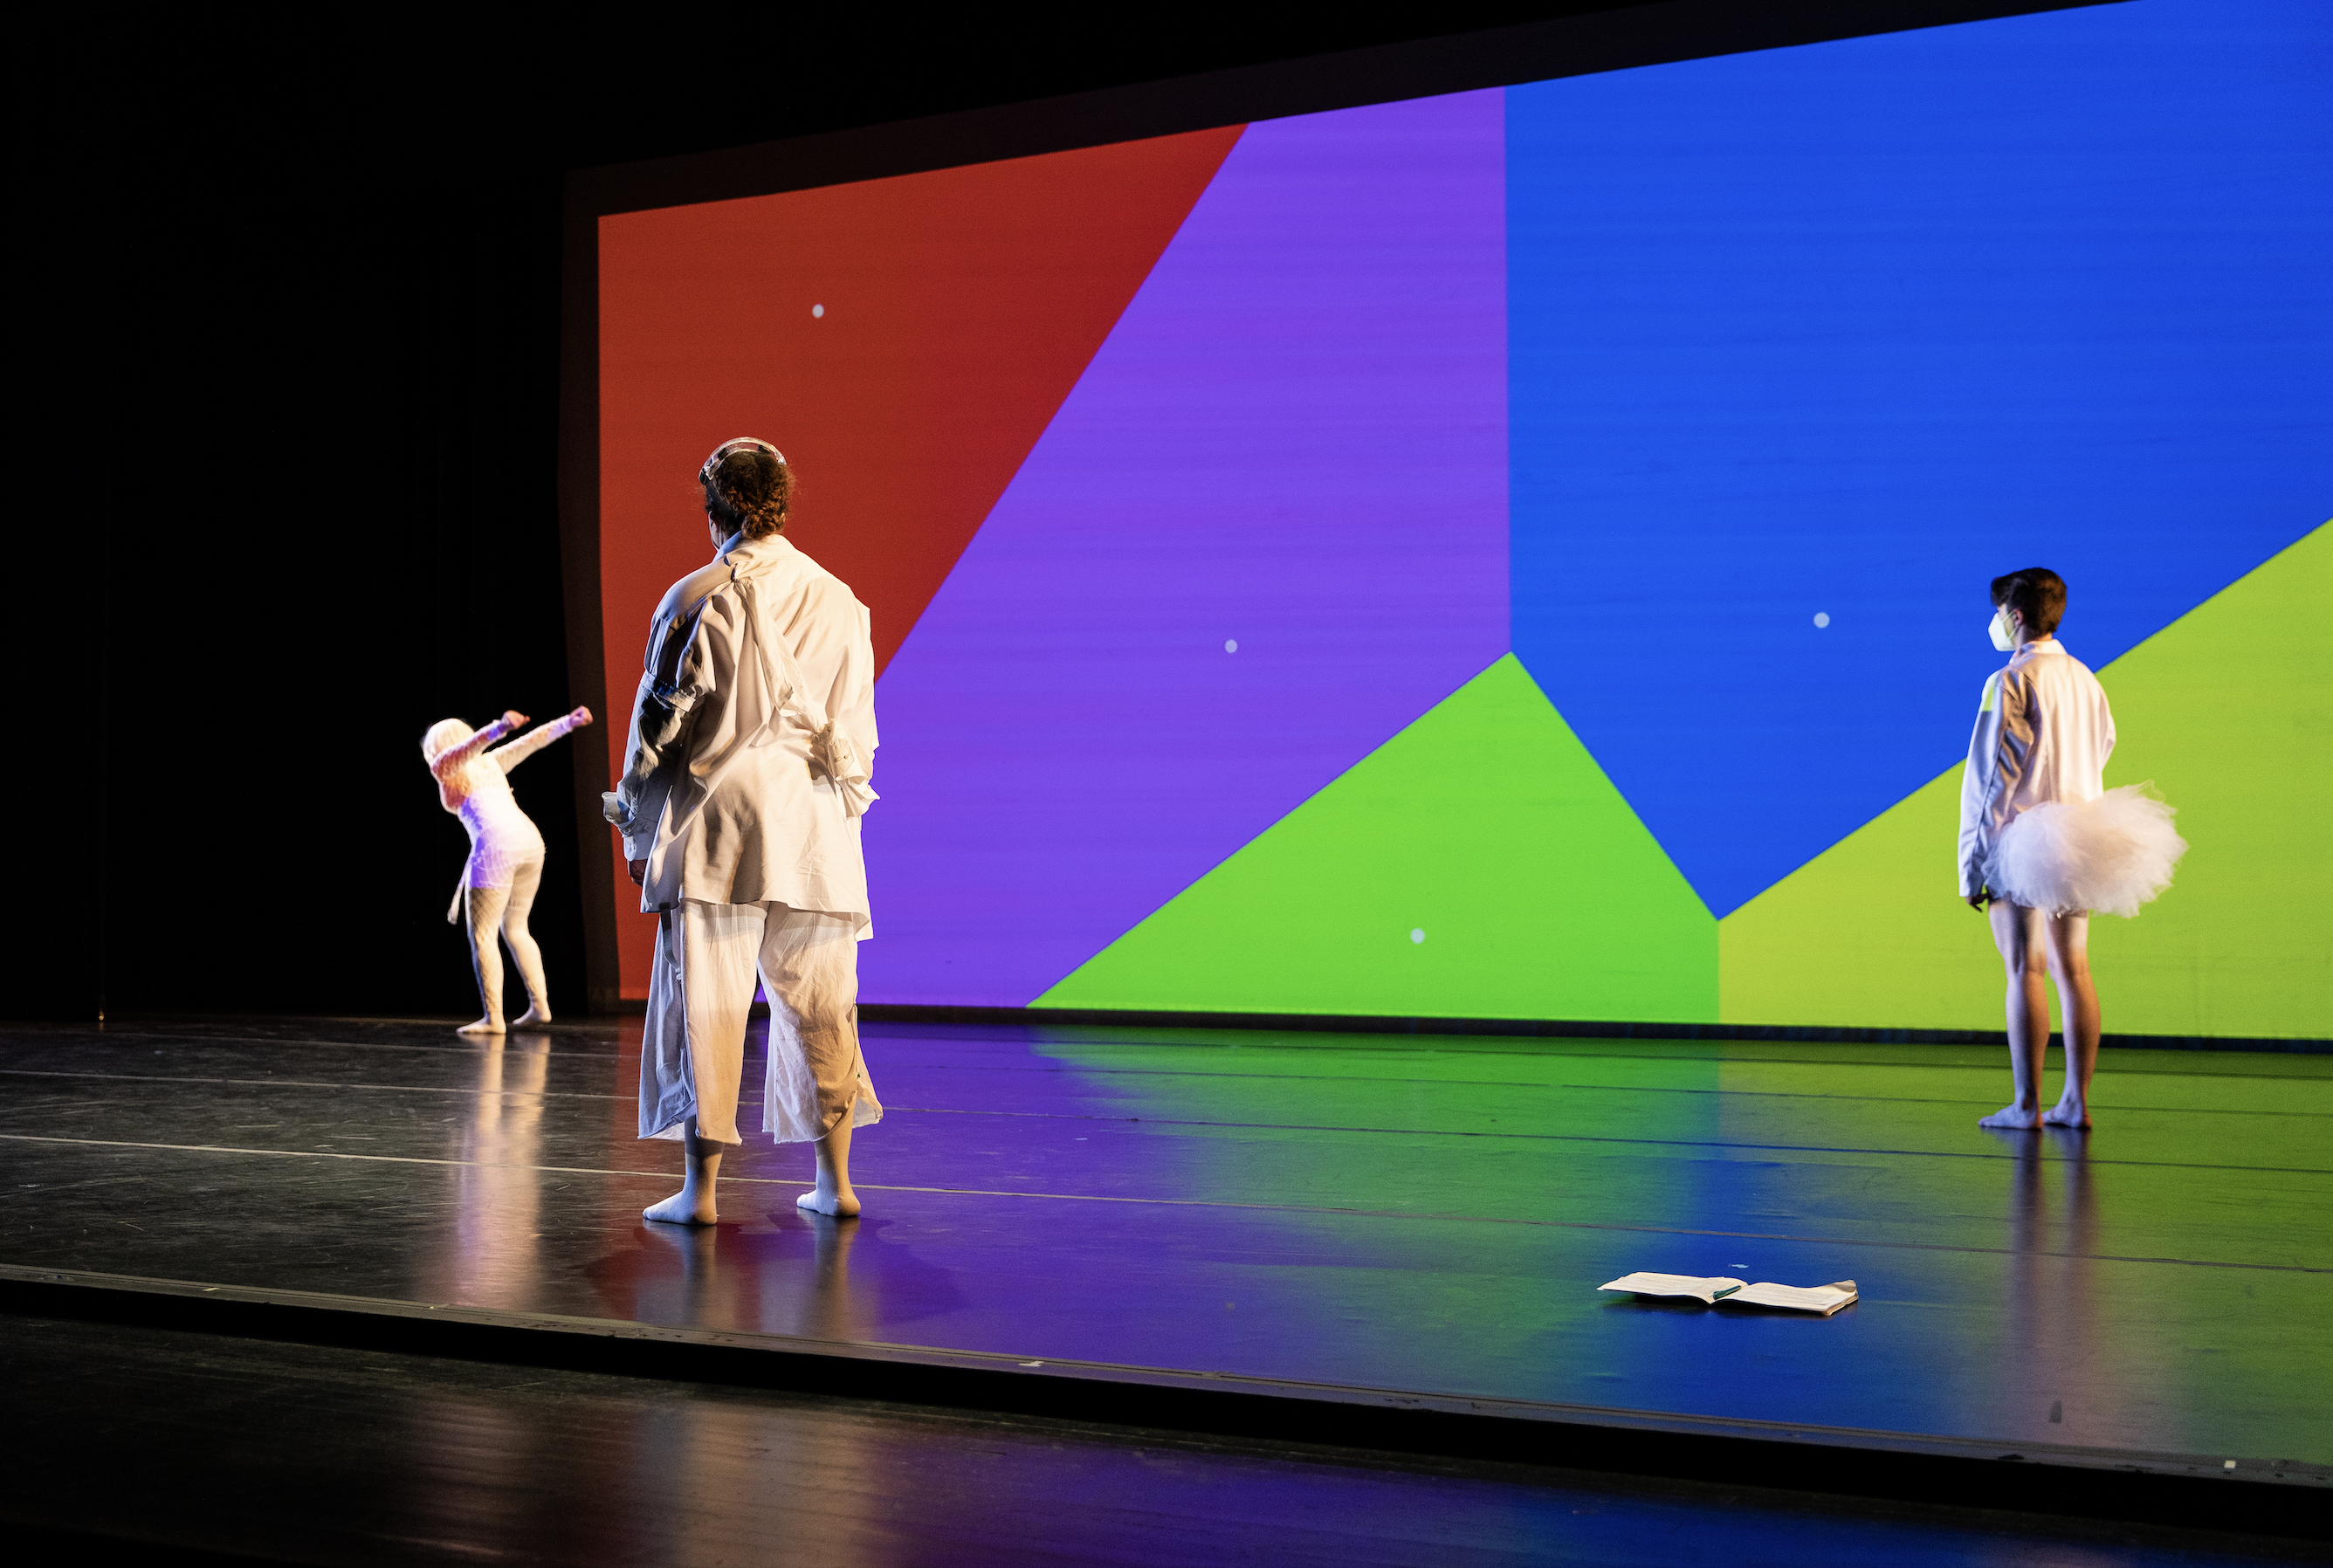
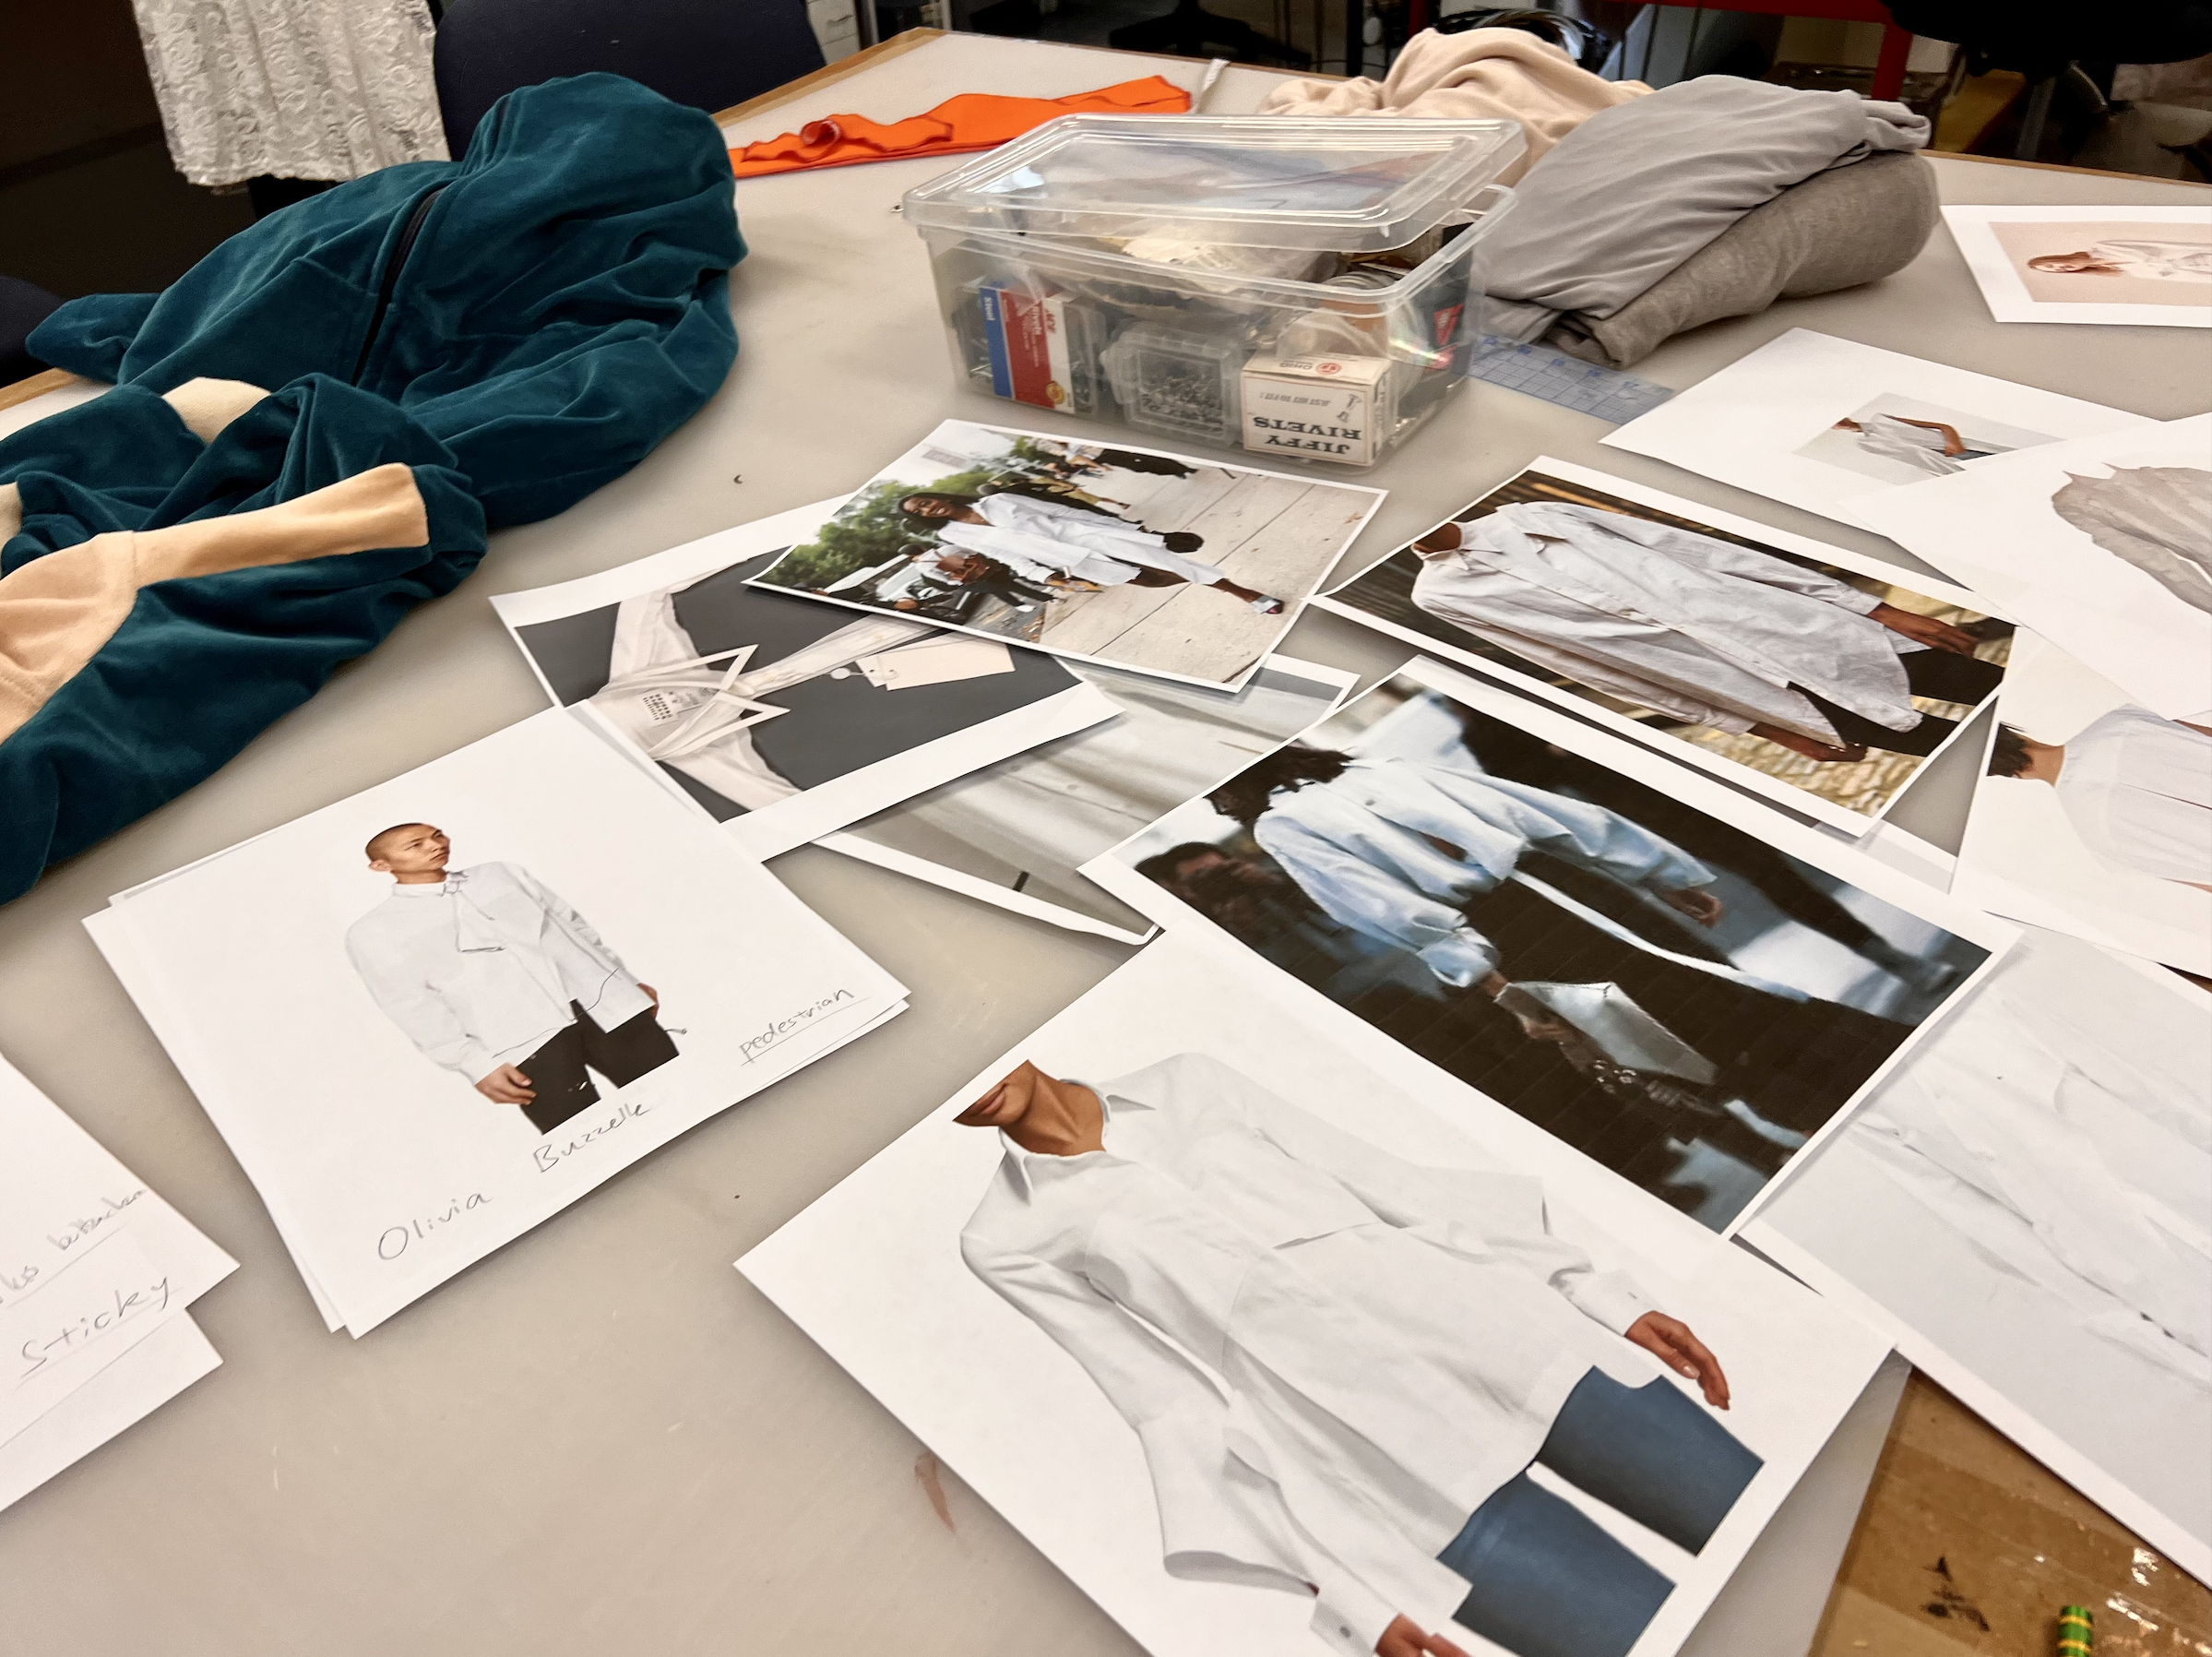
Photo credits: Chris Kayden, Dwayne Tang; Costume design: Liz Prince, Rose Xu
Artist’s Notes
American liberal arts education made me realize that a lot of human’s ideas are essentially the same, but are just investigated through different disciplines – just like one sentence can be said in multiple languages. Fascinated, I believe one discipline can be an inspiring perspective for pushing another discipline forward, if there is enough creativity and understanding about the two disciplines. Trained both as an artist and a scientist, I investigate how math and dance can speak for one idea with the help of technology, in this Dance Senior Thesis Project (part 1*). I hope this piece facilitates more understanding between humans in this world.
*part 2 is a completely different project, entitled “Tao, 1, 2, 3, ∞”
︎ Click on figures ︎︎︎
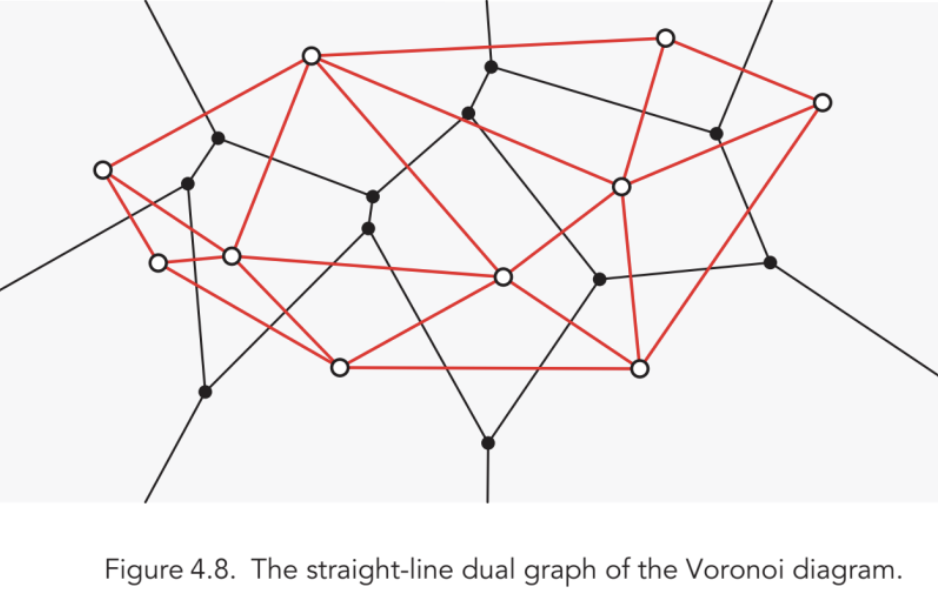 Fig. 1: Voronoi dual graph from Discrete and Computational Geometry (Devadoss-O’Rourke)
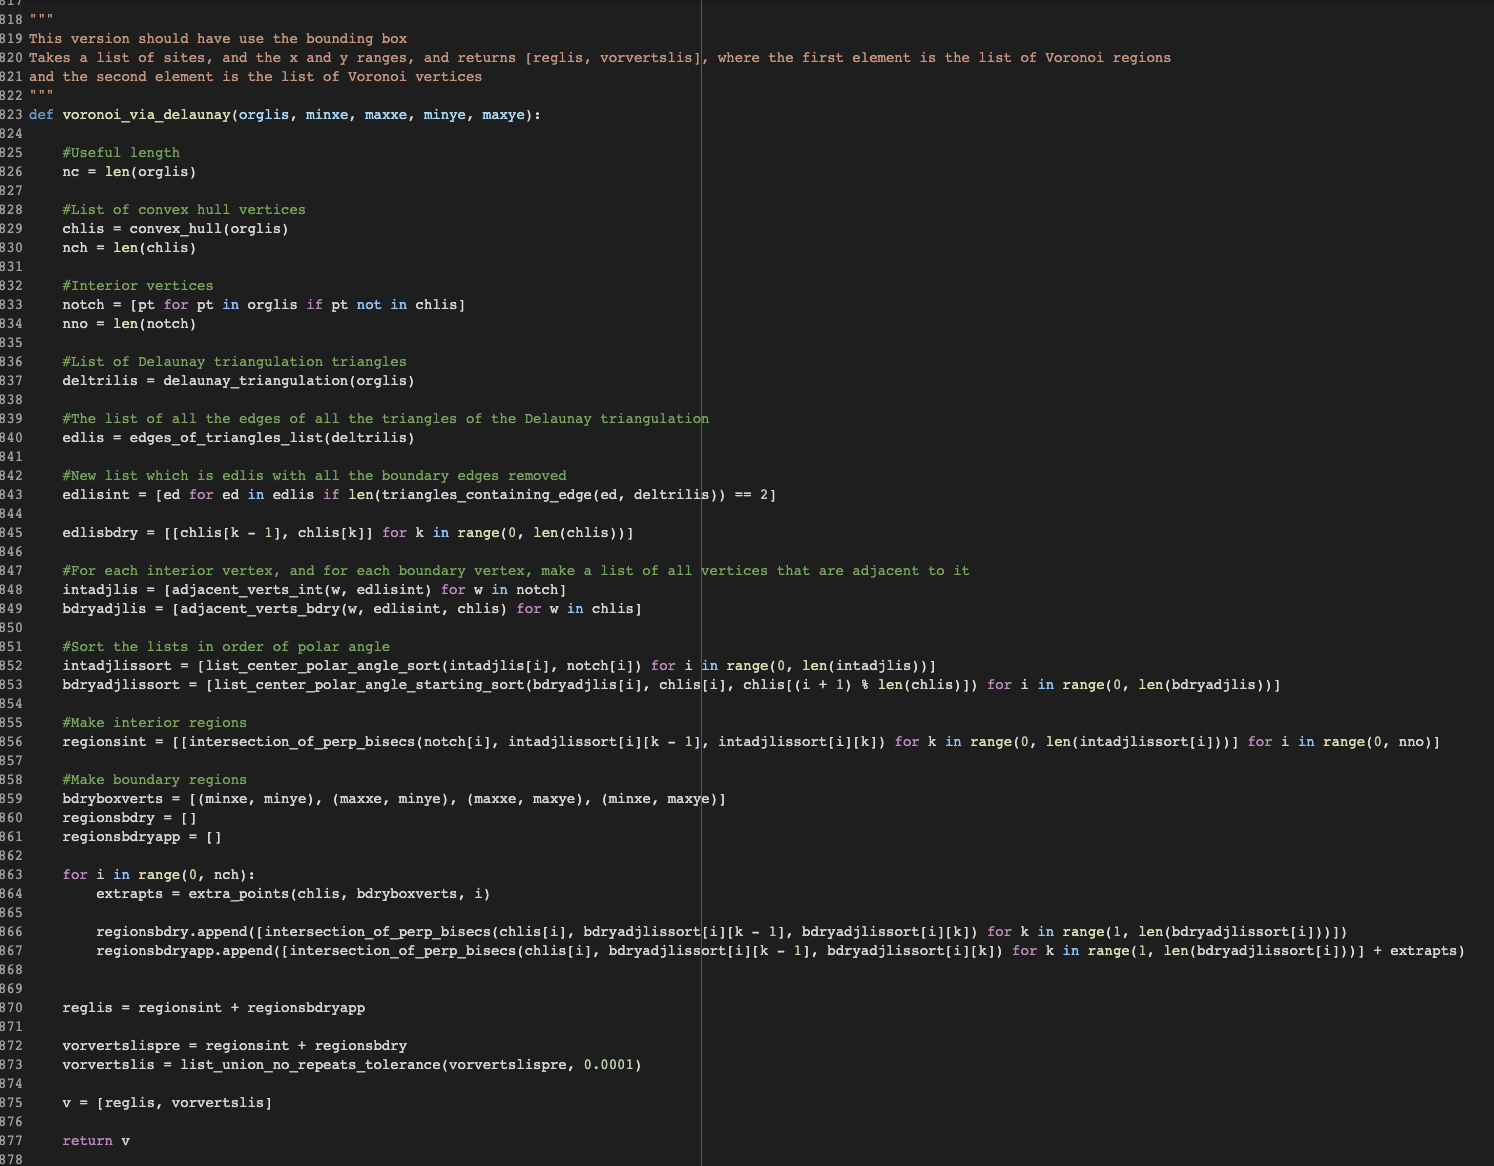
Fig. 2: Partial code for plotting Voronoi Diagram (VD) preciesely using Delaunay Triangulation
 Fig. 3: Example VD produced using the algorithm in Fig. 2
Fig. 4: “Translating” math into dance
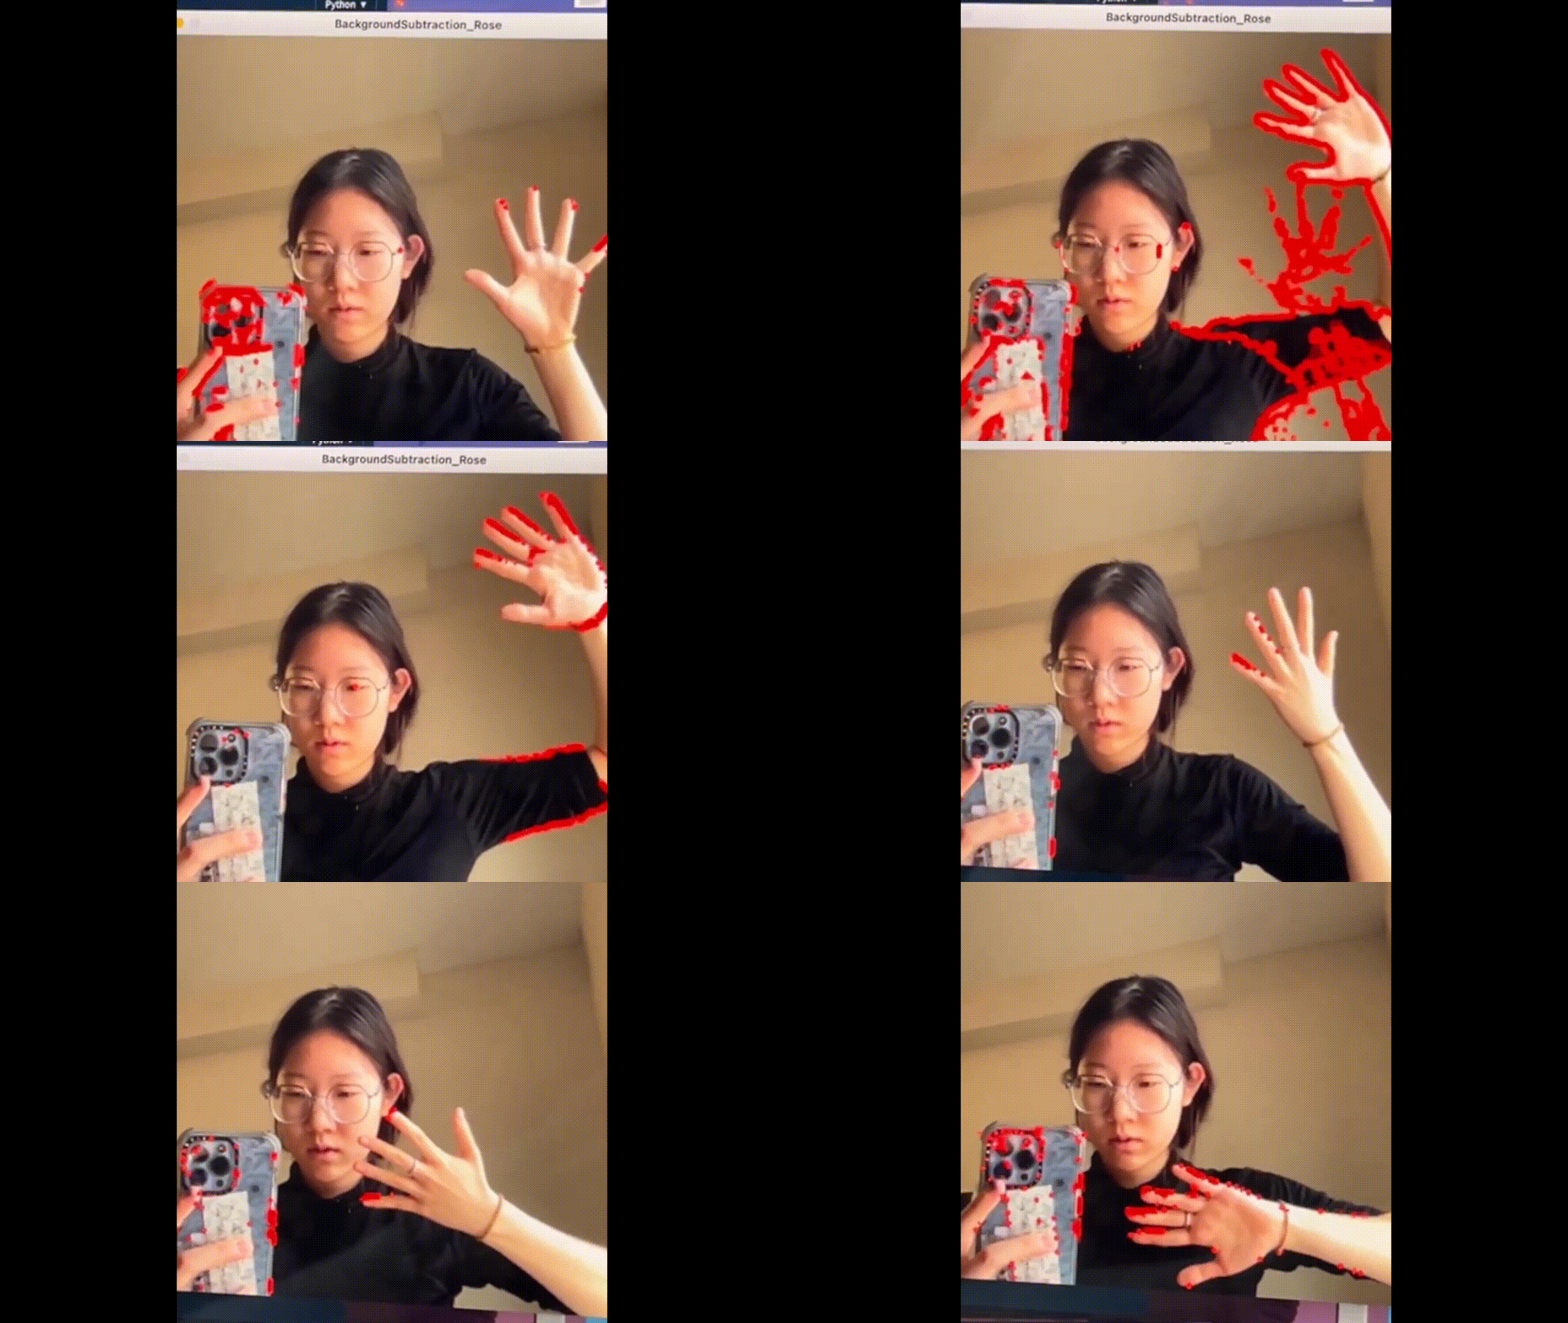 Fig. 5: Motion capture - detect movement
 Fig. 7: Plotting VD in motion
Fig. 8: The key is approximiation
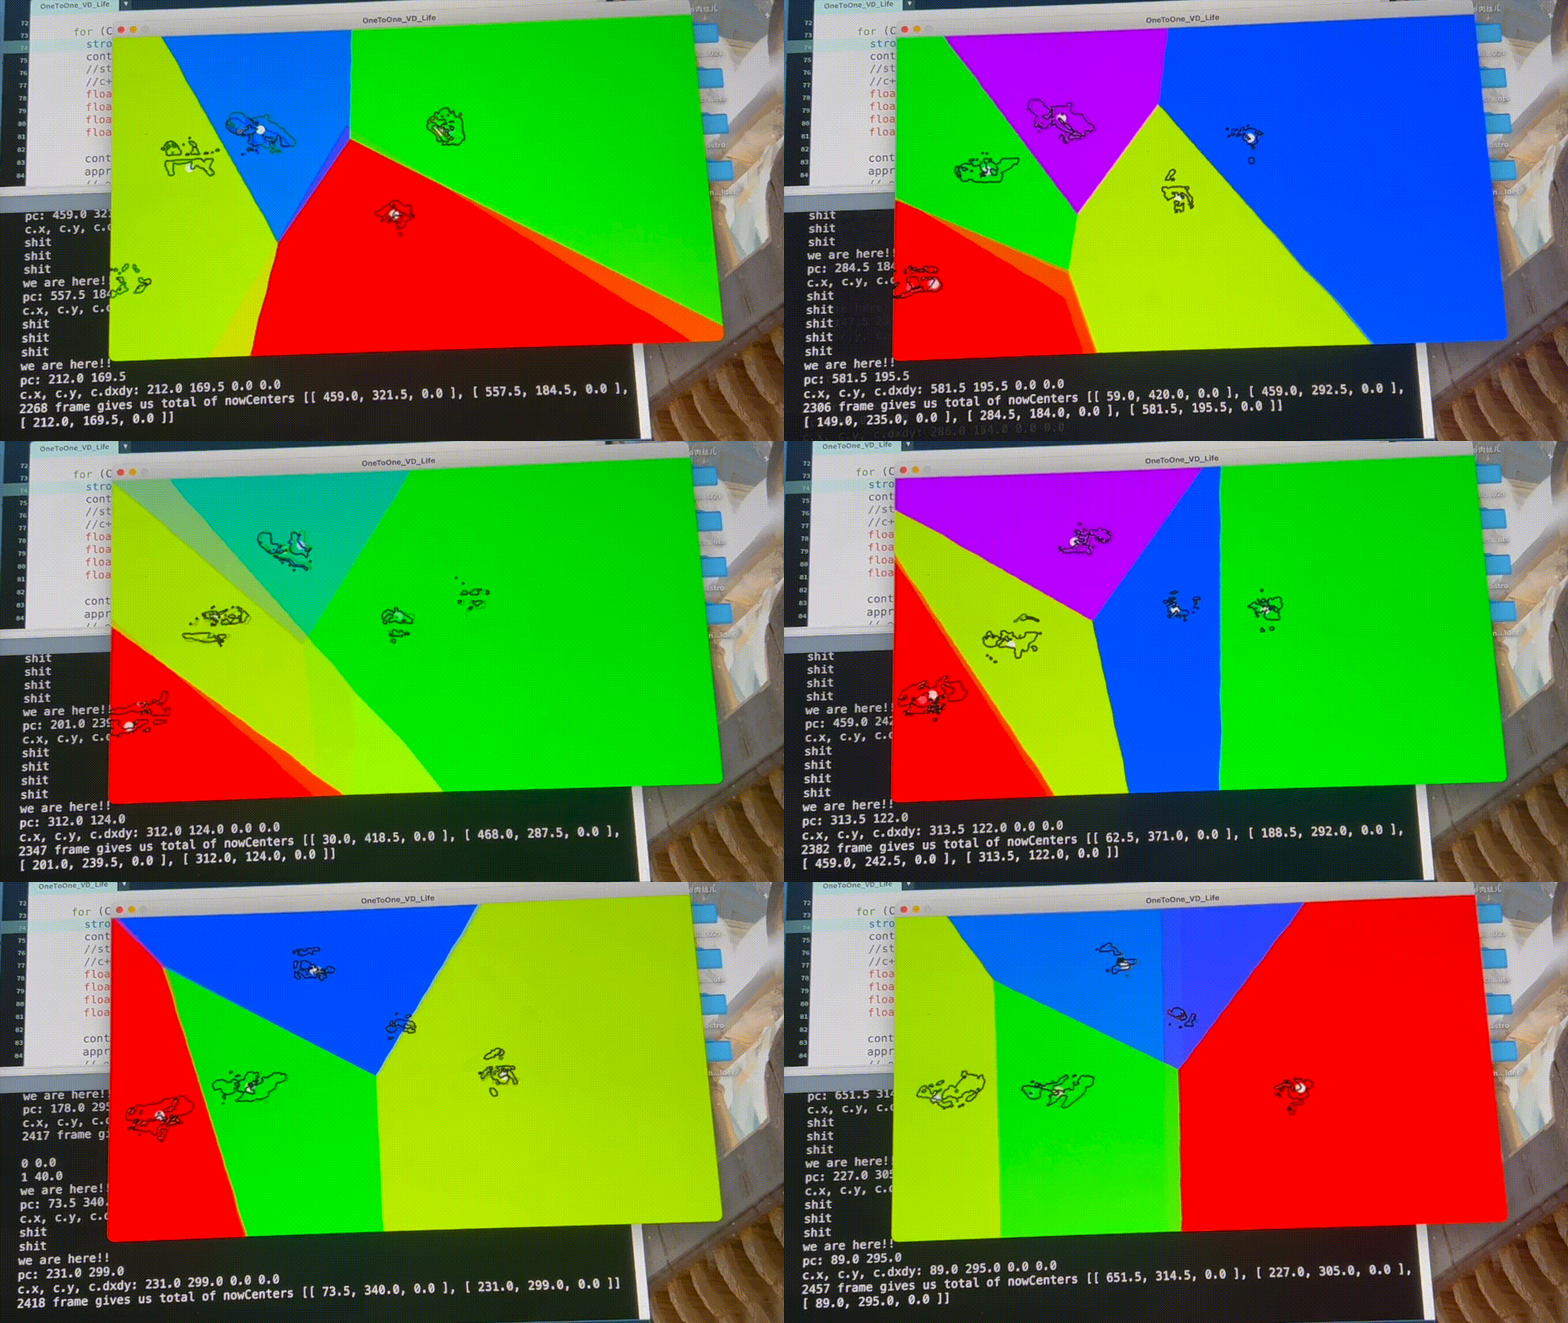 Fig. 9: Jaggy movement before applying “grabitational field” and motion average algorithms
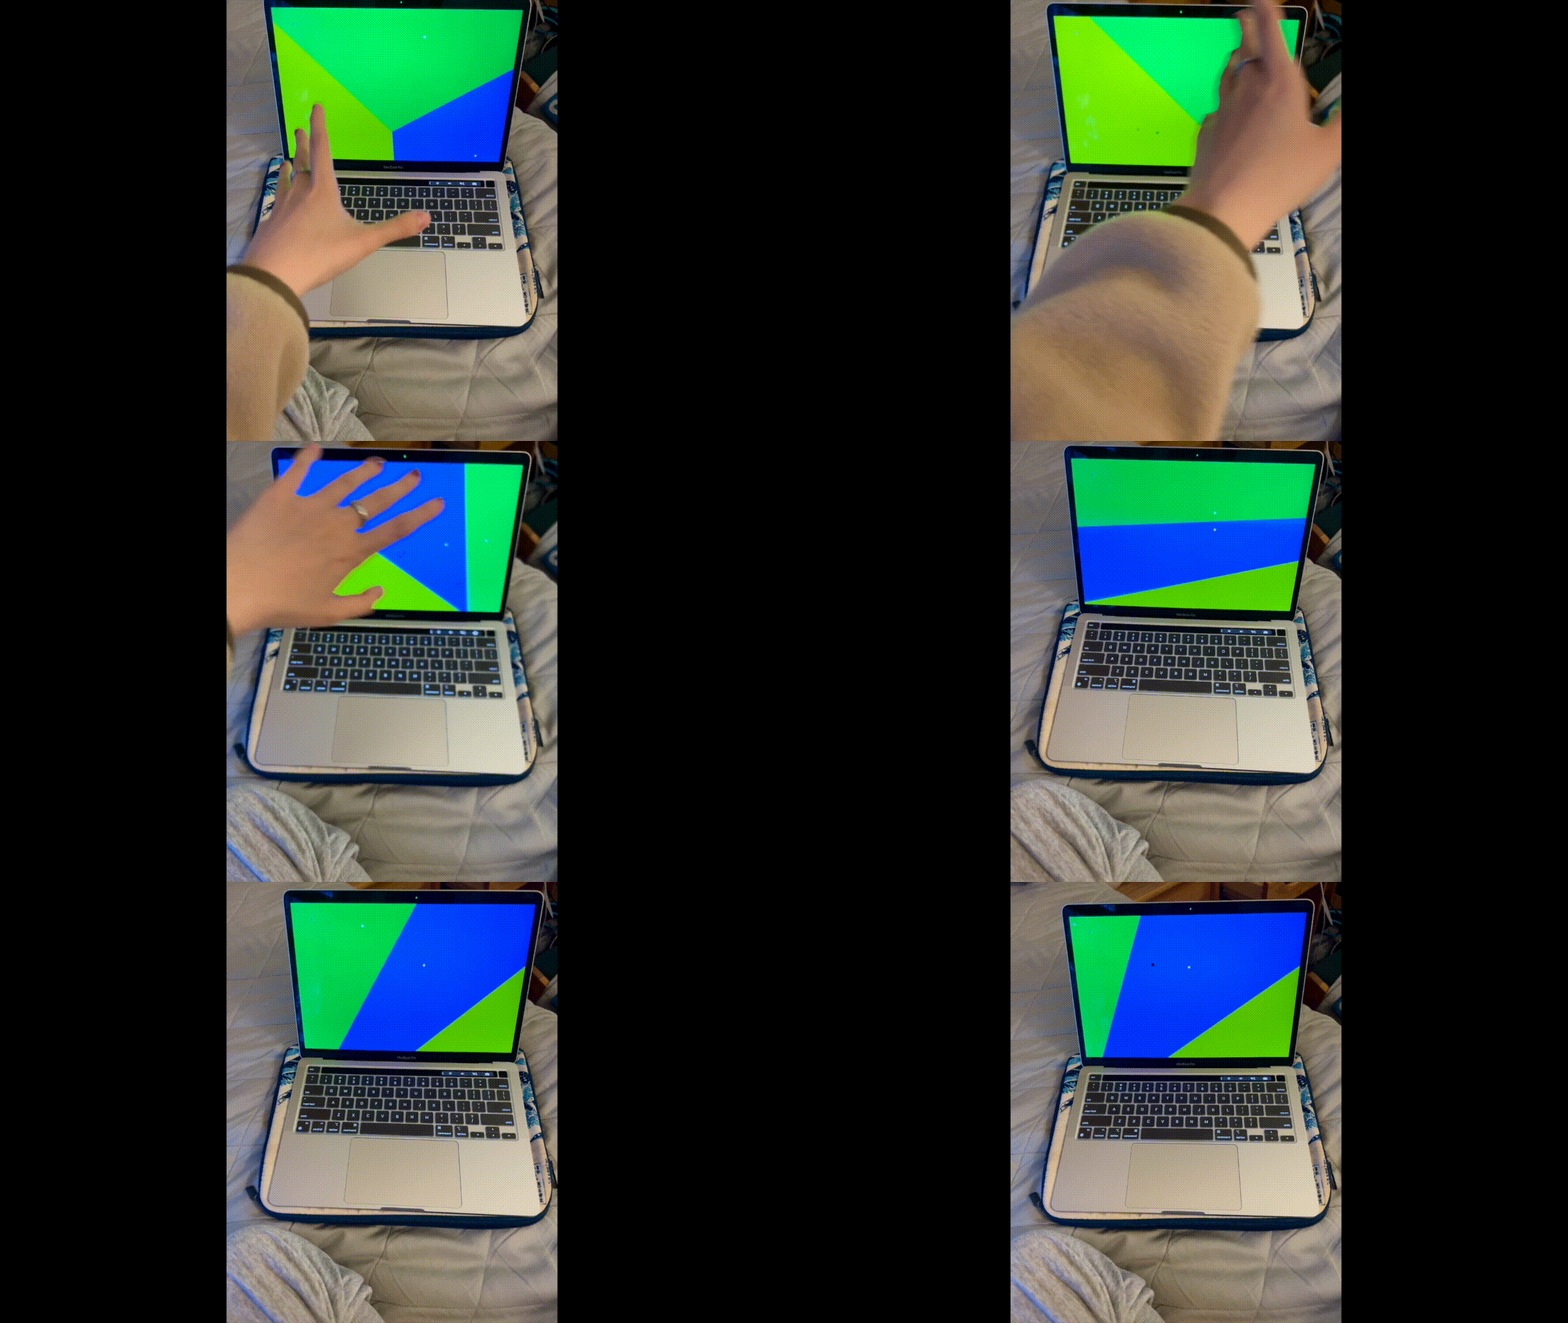
Fig. 10: Smooth movement after optimizing the algorithm

Fig. 11: Mock visual rendering before going into the theatre
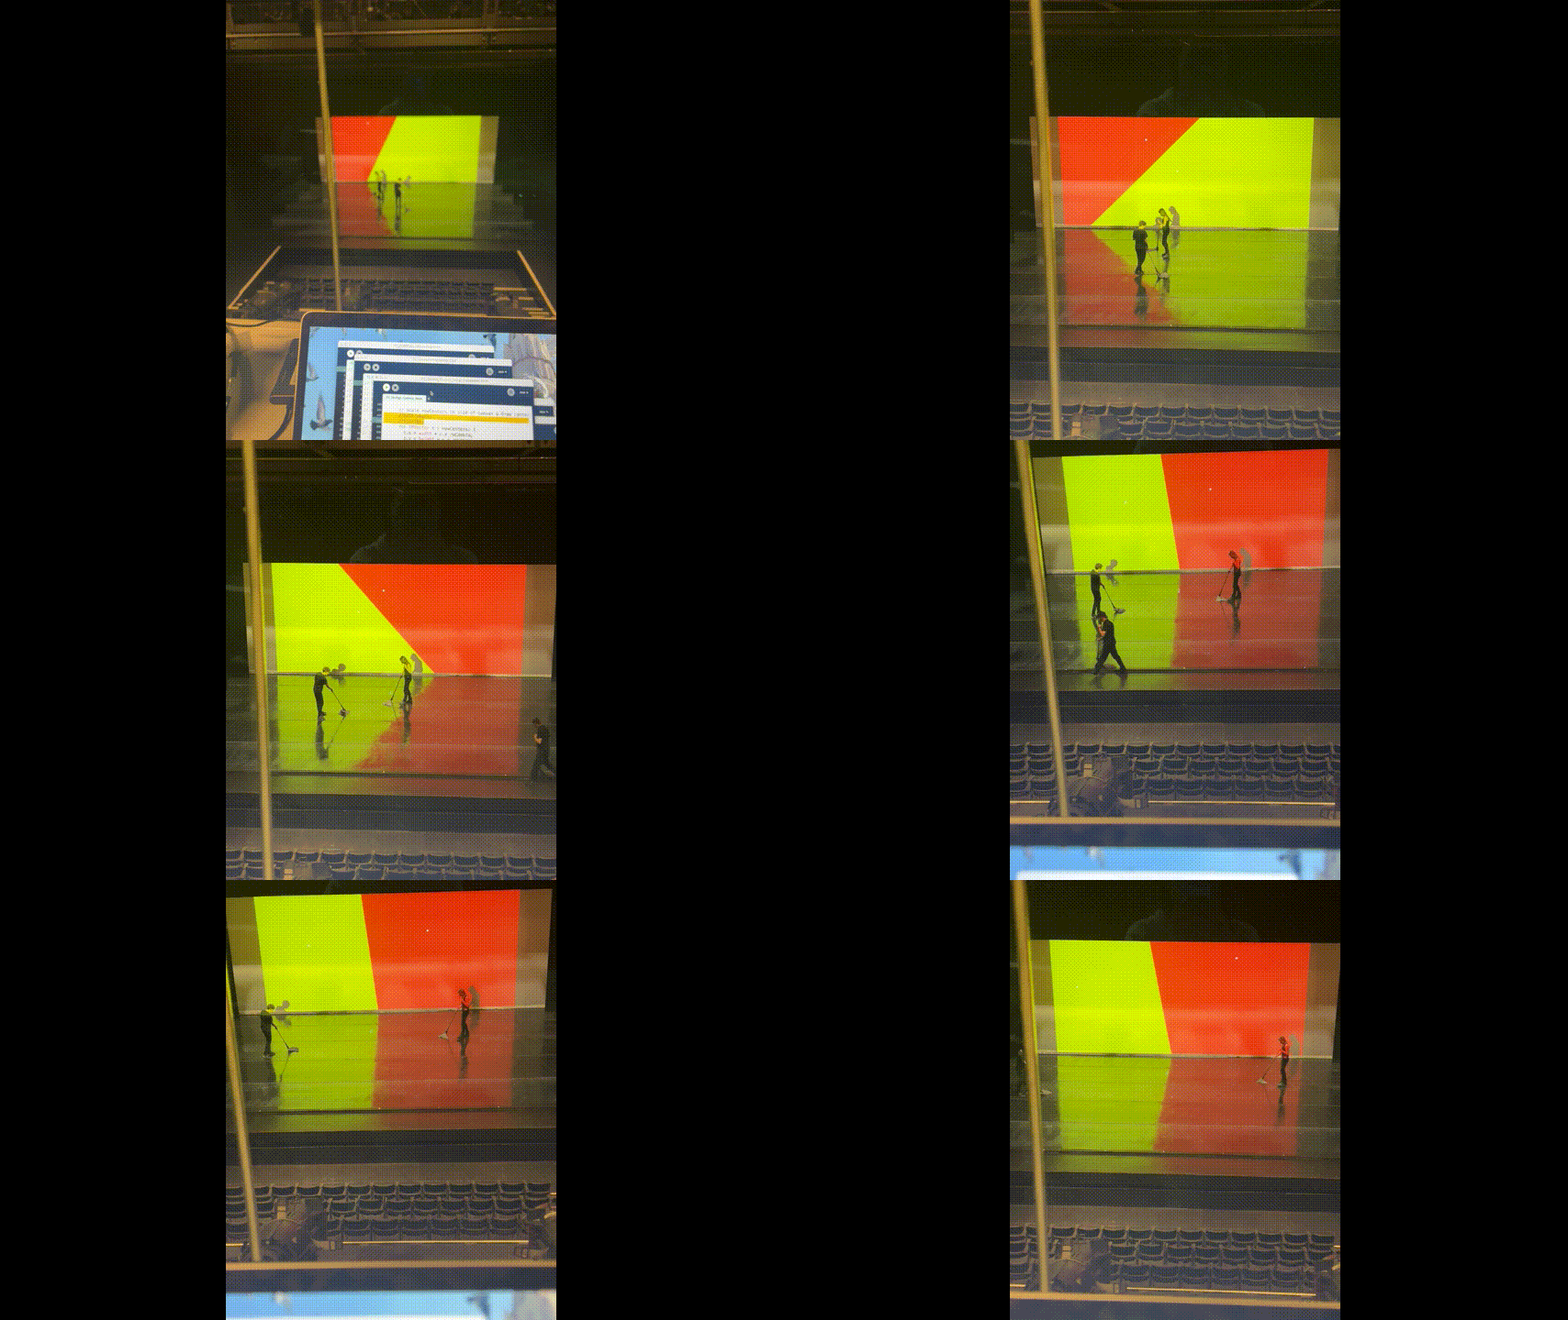 Fig. 12: Tech working properly in theatre. (That third guy was outside camera’s view.)
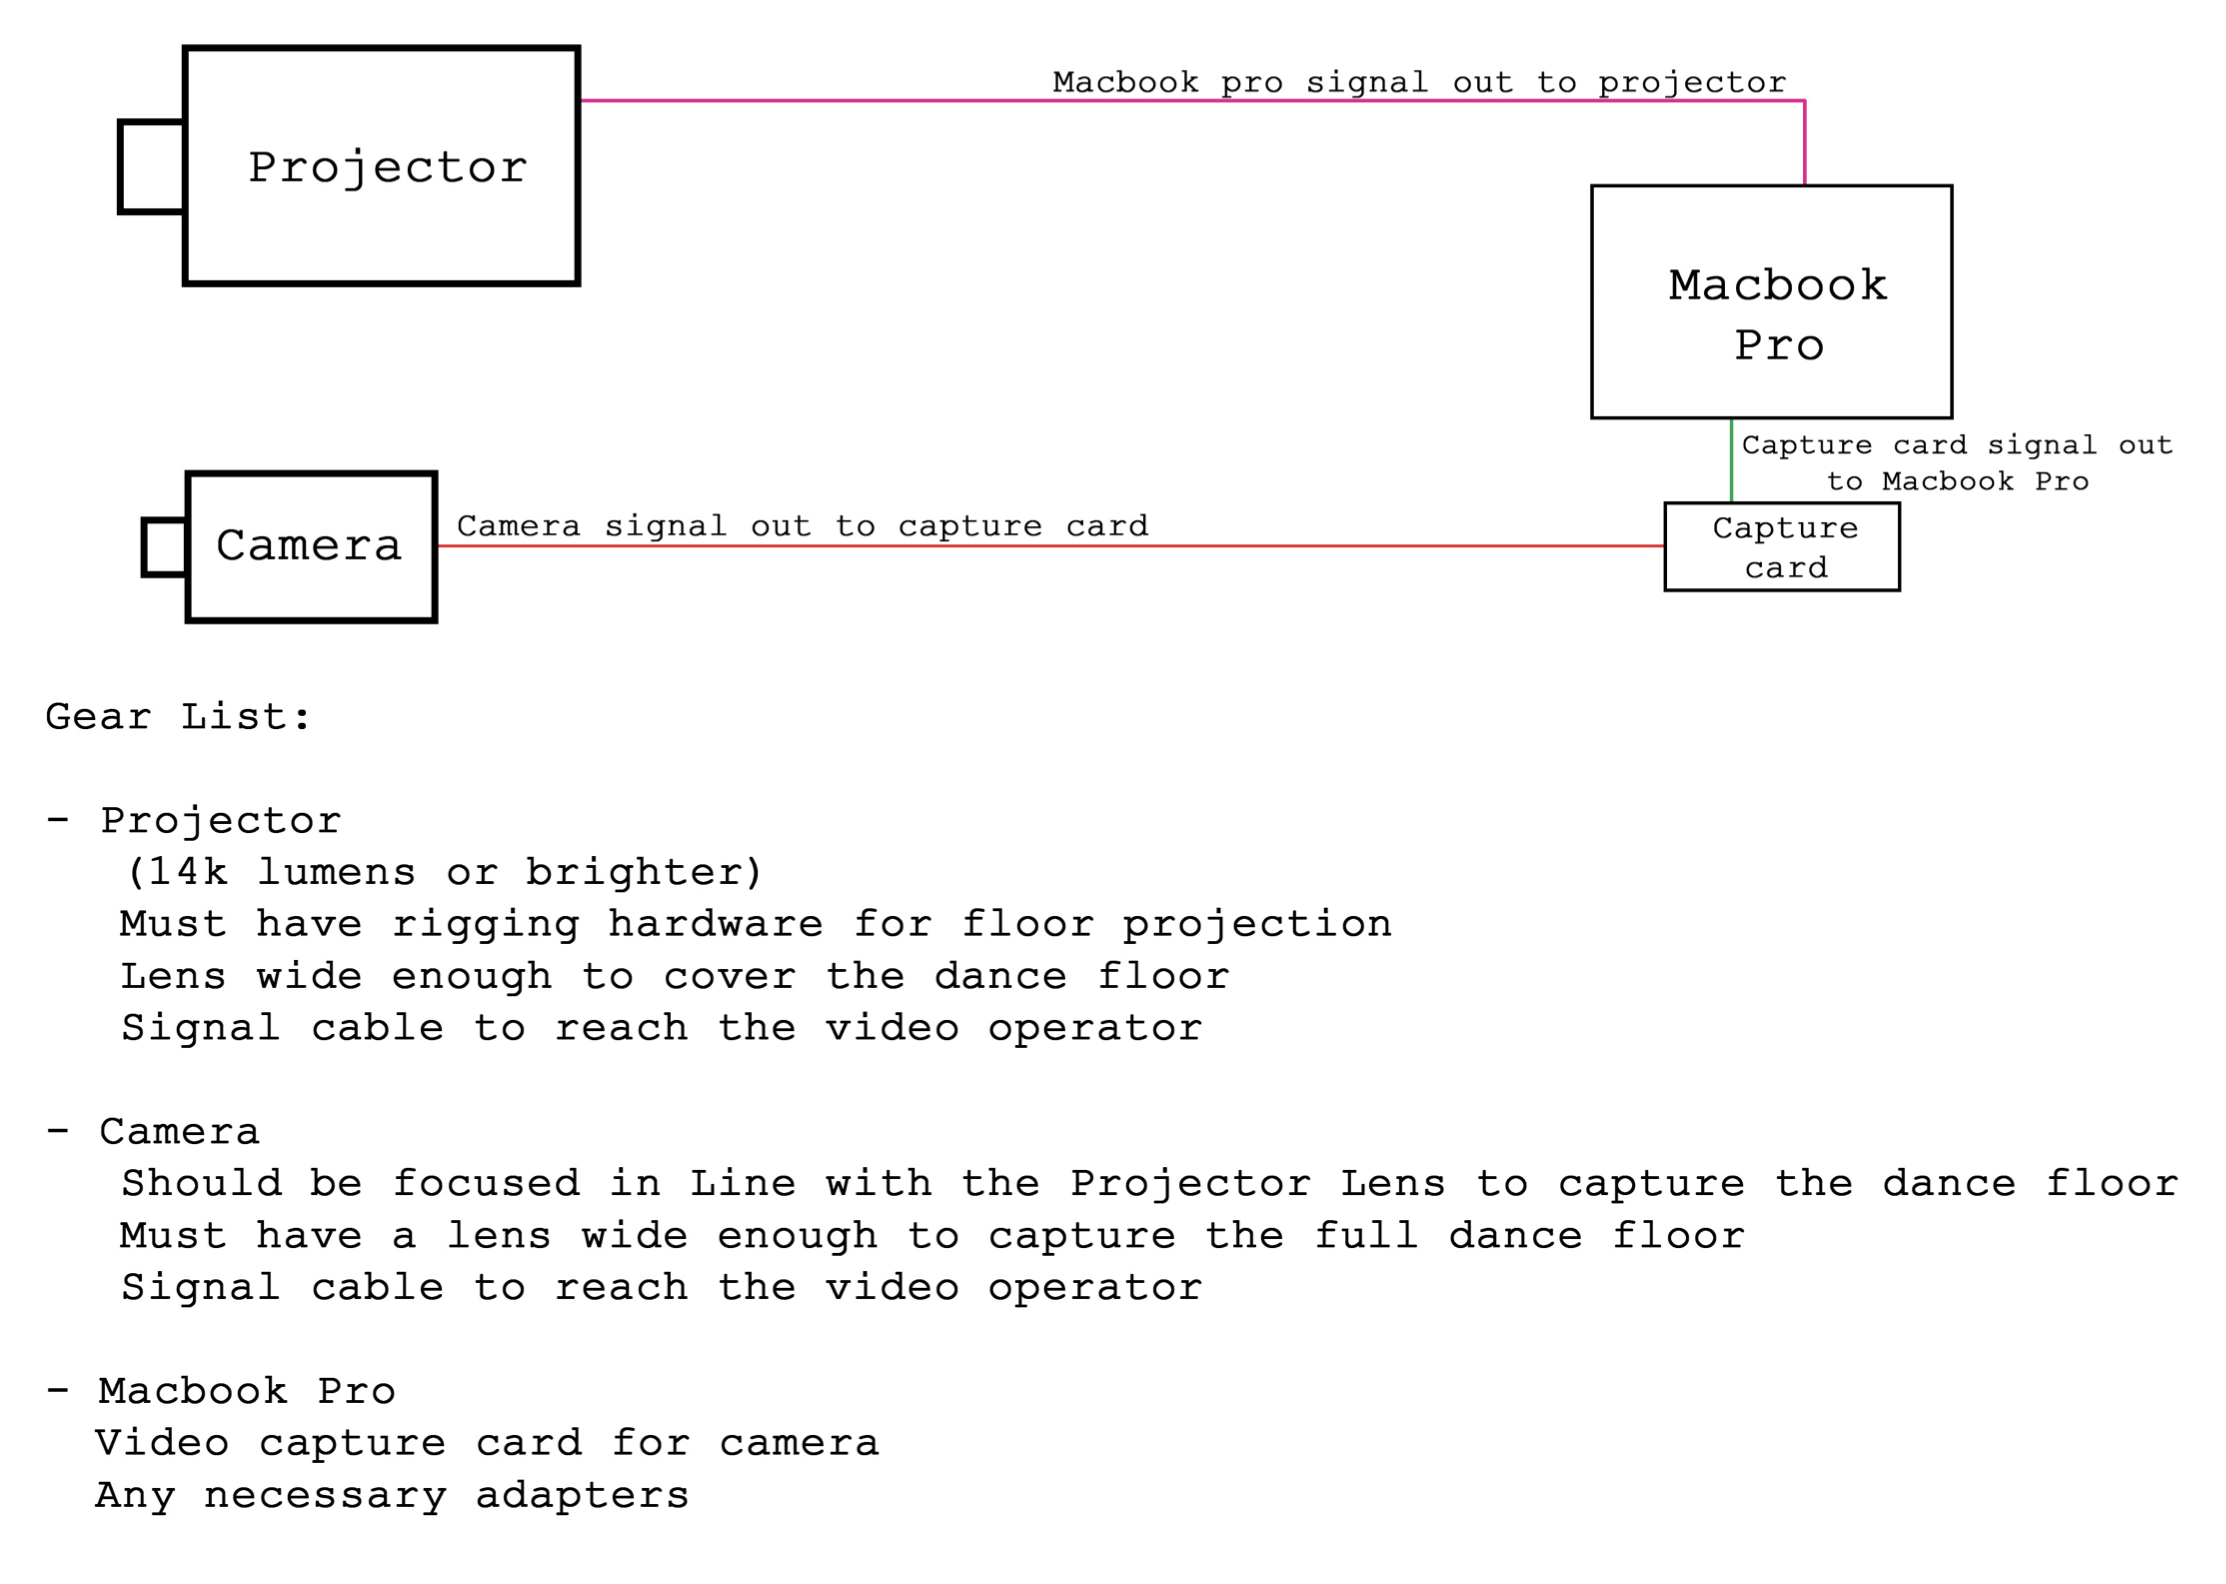 Fig 13: Illustration for the technical set up of the camera-laptop-projector system in the theatre.
Credit:
Katerina Pagsolingan @Fisher Center, Bard College.
︎︎︎Final Product (Partially)
︎︎︎ see full choreography at the bottom of this page
Work Process (Technically)︎︎︎
Inspiration & Math Background
In math, a Voronoi Diagram is an algorithm to break up a plane into regions, each of which includes all points that are closest to the Voronoi site (a designated point) in each region. It has many applications in computer science and in urban planning, for example in building air-raid shelters for a residential area.
In the textbook Discrete and Computational Geometry (Devadoss-O’Rourke), Corollary 4.25.2 states that,
“Let S ⊆ R2. Suppose that S is finite, that the sites in S are not all collinear, and that no four sites of S are cocircular, then the triangulation induced by the straight-line dual graph of Vor(S) is a triangulation of S.”
This is basically saying that we can mathematically prove that the Voronoi Diagram infers Delaunay Triangulation. As a student, I am curious if we can reverse that relationship. Though I could not find theorems to help me prove that Delaunay Triangulation infers a well-defined Voronoi Diagram, Prof. Ethan Bloch encouraged me to try plotting the Voronoi Diagram (VD) using the Delaunay Triangulation algorithm that we learned from the textbook.
Shown in Fig. 2, we developed a original Python algorithm to plot a well-defined Voronoi Diagram via Delaunay Triangulation. This does not prove the inverse statement, but shows that it is true computationally. The code turned out taking up ~a thousand lines with runtime 1.4 seconds on my machine to plot VD with given sites as shown in Fig. 3.
As a choreographer, although I studied the VD in stillness, my logical brain knew that the diagram would look completely different if one point (Voronoi site) changes location - which totally fascinated my creative brain because it seemed to me like a dance. As Einstein says, science and art have come together in my head in aesthetics; but in order for other people to see that in physical form, new technology is needed. Therefore, I decided to program the VD in motion, and create a performance to let dancers move the diagram.
Motion Detection
This project aimed to translate an idea conveyed in “math language” into “dance language”, and to put an integral product of science and art on stage with support of new technology. Specifically, I decomposed the fundamental ideas in the Voronoi Diagram, used dance vocabulary to recreate these ideas using the body and the space (see Fig. 4), and also created a series of programs to visualize the ideas in the live performances.
To embody this “translation” with technology, I first need to “teach” my computer to recognize moving dancers. For the performance, a infrared wide-angle camera was built above the stage to capture live motions from birds' view. I used the OpenCV for Processing package to find the contours of moving bodies (see Fig. 5). Then, I developed my original algorithm to find the center of each person, which later served as the Voronoi site (see white dots in Fig. 6).
Moving Voronoi Diagram
While trying to plot VD in motion using the centers of dancers as the generating Voronoi Sites, I soon realized that my one-thousand line VD algorithm was not great for rendering visuals for live performance because the run time was too long. So I studied Hoff’s algorithm on plotting approximations of VD (Hoff, Kenneth E., et al.). That algorithm, especially when written in the Processing environment, was very concise (see Fig. 7) - only took up 80 lines and so was convenient to generate VD in a loop. The more edges (characterized as variable n in codes in Fig. 7) the triangle_fans have, the closer the approximation is to a well-defined VD. See Fig. 8 for the number of rays defined by the variable n.
Issues occurred when I generated VD according to the dancers’ locations frame by frame - the visual didn’t look smooth (see Fig. 9). To solve this problem, I wrote an algorithm letting the centers of dancers “attract” the Voronoi sites like a gravitational field. With motion averaging, the Voronoi regions would drift smoothly behind objects, as shown in Fig. 10.
Real Life Challenge
At this point, I have created the new technology that I needed to help me augment the dance choreography and to embody the connection between art and science. I expected the projection to look similar to Fig 11 in the performance. However, life was more dramatic than drama - 4 out of 5 of my performers got tested positive for COVID two days before the show. Fortunately, I found two amazing student dancers to learn my choreography in one day and we enabled the four shows to go on as scheduled. Thus, the official performance was completed by three dancers instead of five with truncated choreography.
Moving forward, I am planning to put on the five-person full version of the performance at the Gibney dance company in New York City that Bard College has collaborated with, in May 2023. Feeling grateful for the Bard community which enabled me to create this piece and being eager to let more people fall in love with breaking the boundary between art and science, I will lead a workshop at the Bard Dance Program in March 2023, to share my new tools with the community and let the choreographers apply and tweak my tools in serving their own works.
︎ THANK YOU FOR READING ︎
See Full Performance Recording︎
See Full Performance Recording︎
Works Cited:
1. Devadoss, Satyan L., and O'Rourke, Joseph. Discrete and Computational Geometry. United States, Princeton University Press, 2011.
2. Hoff, Kenneth E., et al. “Fast Computation of Generalized Voronoi Diagrams Using Graphics Hardware.” Proceedings of the Sixteenth Annual Symposium on Computational Geometry - SCG '00, 2000, https://doi.org/10.1145/336154.336226.
Full choreography with the original crew (before the impact of covid-19*), recorded at a tech rehearsal. Note that the technology was still in the debugging stage in this recording.
* We had to change the performers' crew last minute due to covid. Many thanks to the dancers who generously stood in for this work and to everyone who kept the performance going. The hard work of the original crew is deeply appreciated and remembered.
Other Projects ︎
Rose (Ziyu) Xu
zx303@cam.ac.uk Cambridge,UK
zx303@cam.ac.uk Cambridge,UK
